National rent increases for fourth consecutive month but are down year over year
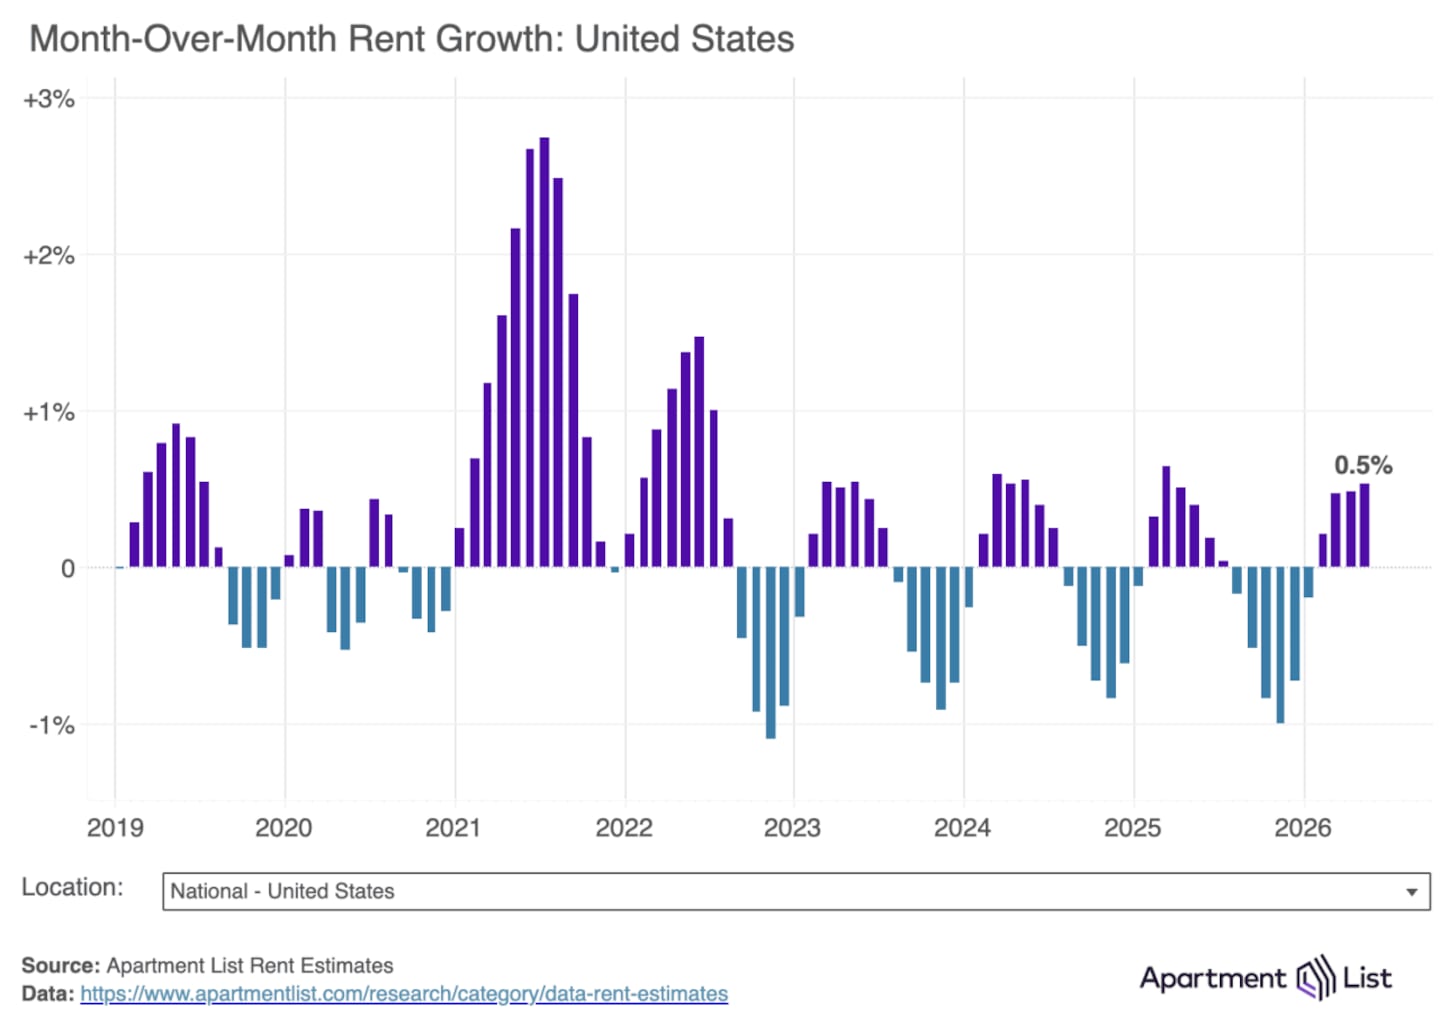
The national median rent ticked up by 0.5% in May, increasing for the fourth consecutive month. We are now entering the time of year when the bulk of moves take place, and as such, we’ll likely see continued price increases through the summer, in line with typical seasonal patterns. Prices generally increase in the spring and summer when most moves take place, and then soften in the fall and winter as moving activity slows.
Apartment List
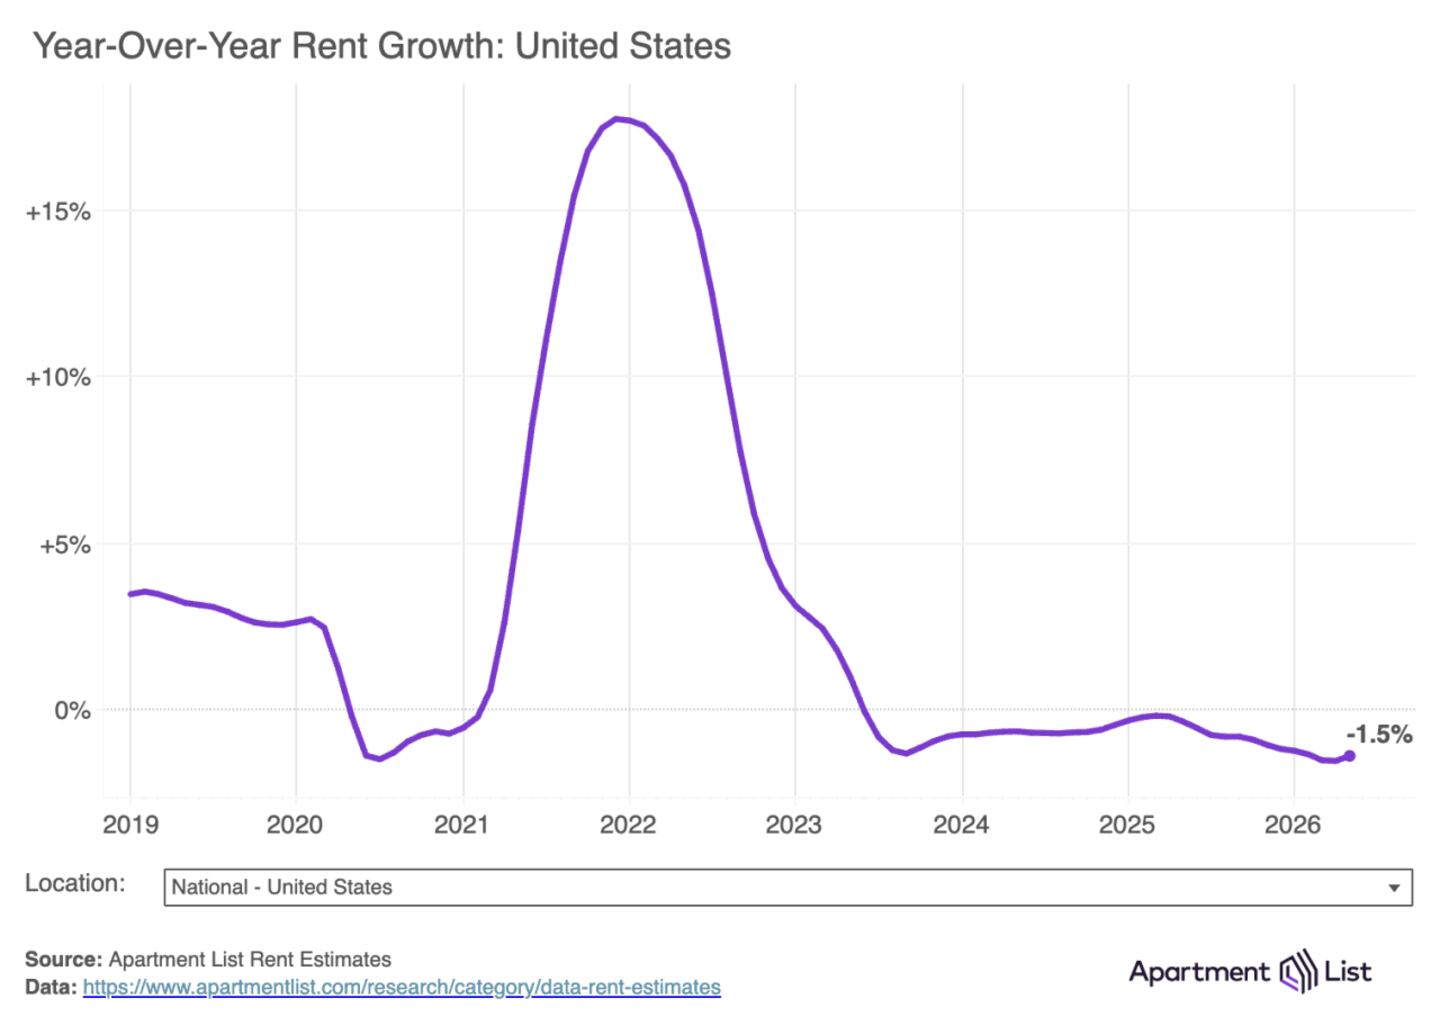
The broad contours of this seasonal pattern have been largely stable, but in recent years, Apartment List reports, there have been sharper winter dips and more modest summer bumps as the market has gone through a soft spell amid a wave of new multifamily construction. As a result, full-year rent growth has been negative for each of the past three years. Currently, the national median rent is 1.5% cheaper than it was one year ago. This year-over-year rent growth figure ticked up slightly from -1.6% last month but remains near the lowest levels seen in Apartment List estimates, going back to 2017. But even a modest uptick marks a notable change in trend, as year-over-year rent growth had been gradually sinking further negative amid a backdrop of macroeconomic uncertainty.
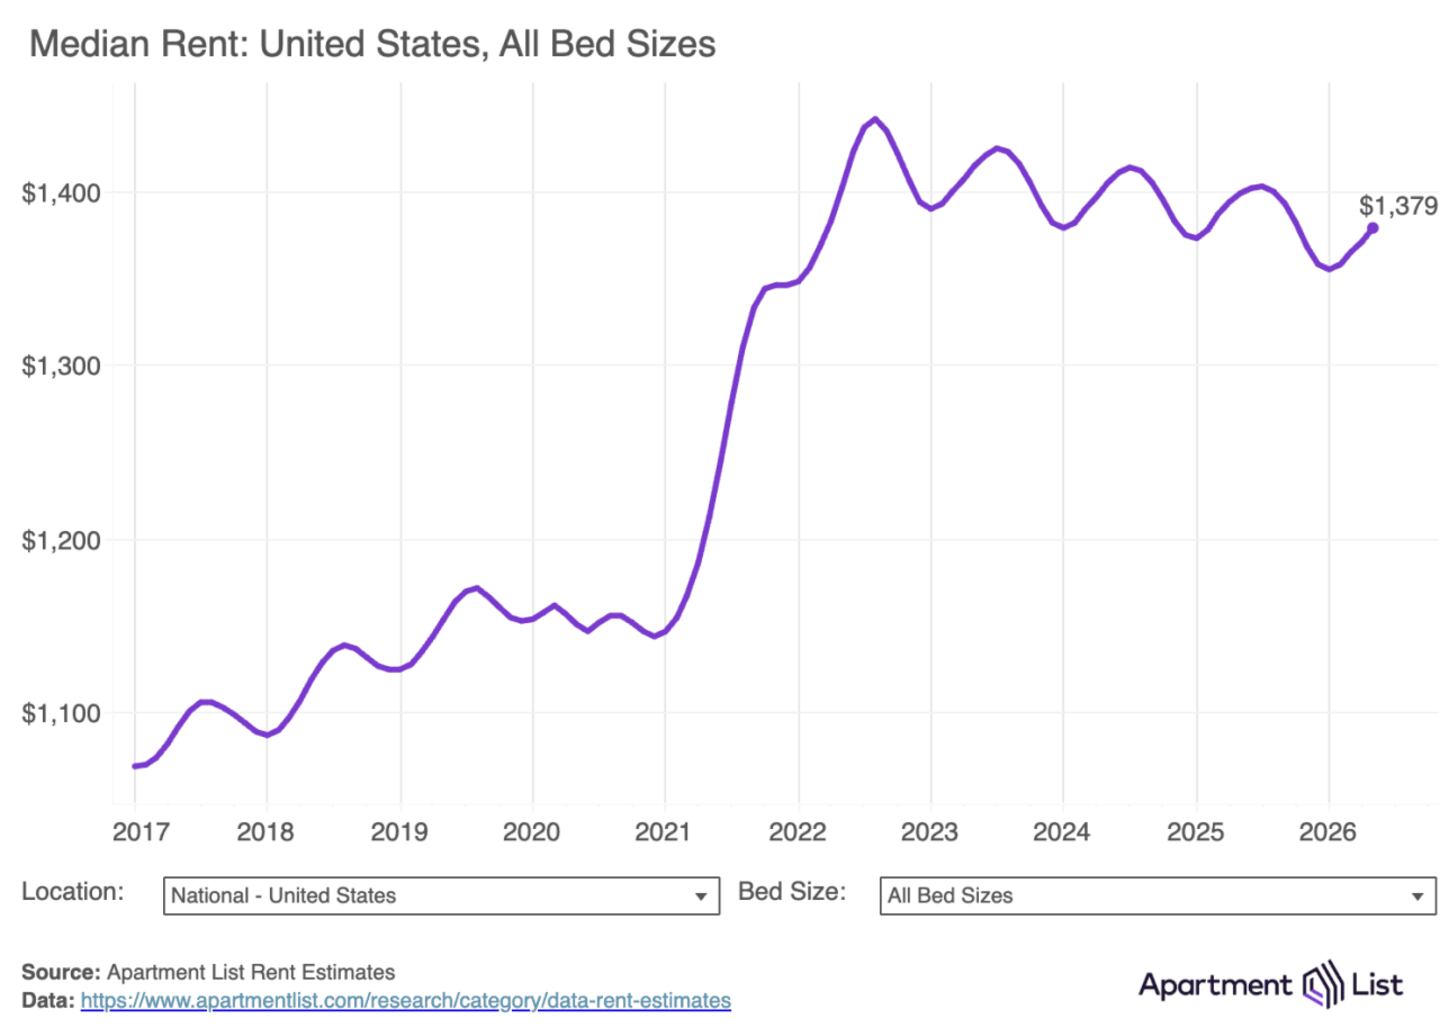
- The national median rent increased by 0.5% in May, and it now stands at $1,379. This marks the fourth straight monthly increase, as the market enters the busy summer moving season.
- Rent prices nationally are down 1.5% compared to one year ago. Year-over-year rent growth ticked up slightly compared to last month but remains near the lowest levels in these estimates going back to 2017. The national median rent has now fallen from its 2022 peak by a total of 4.4%.
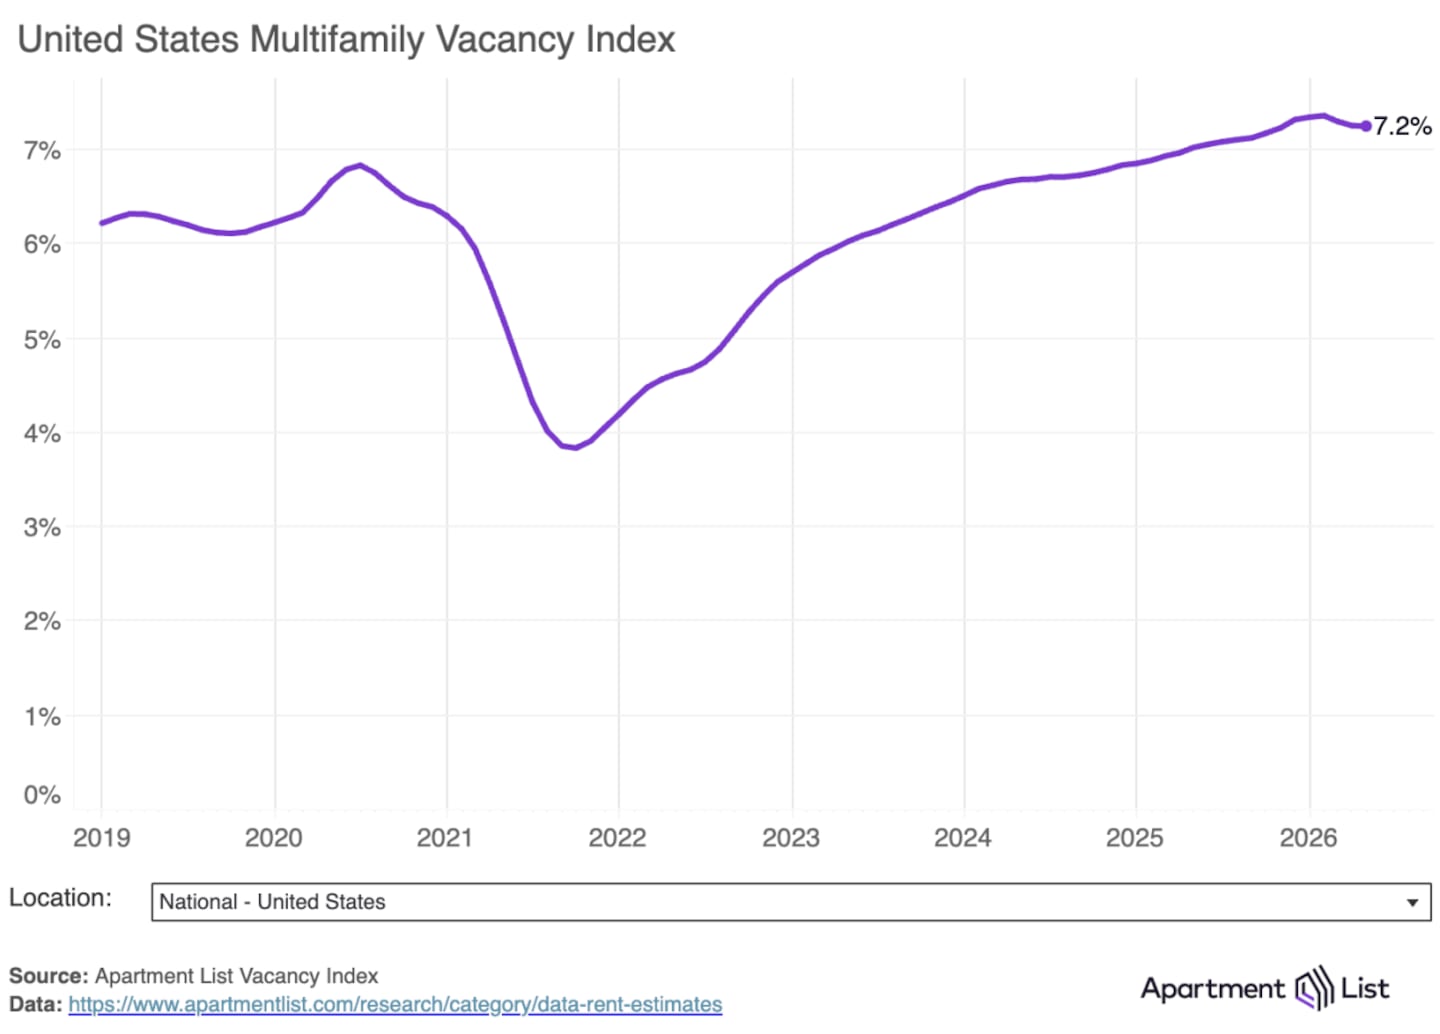
- The national multifamily vacancy rate currently stands at 7.2%, down slightly from the February peak. After hitting a new record in February, the vacancy rate is now decreasing for the first time in over four years.
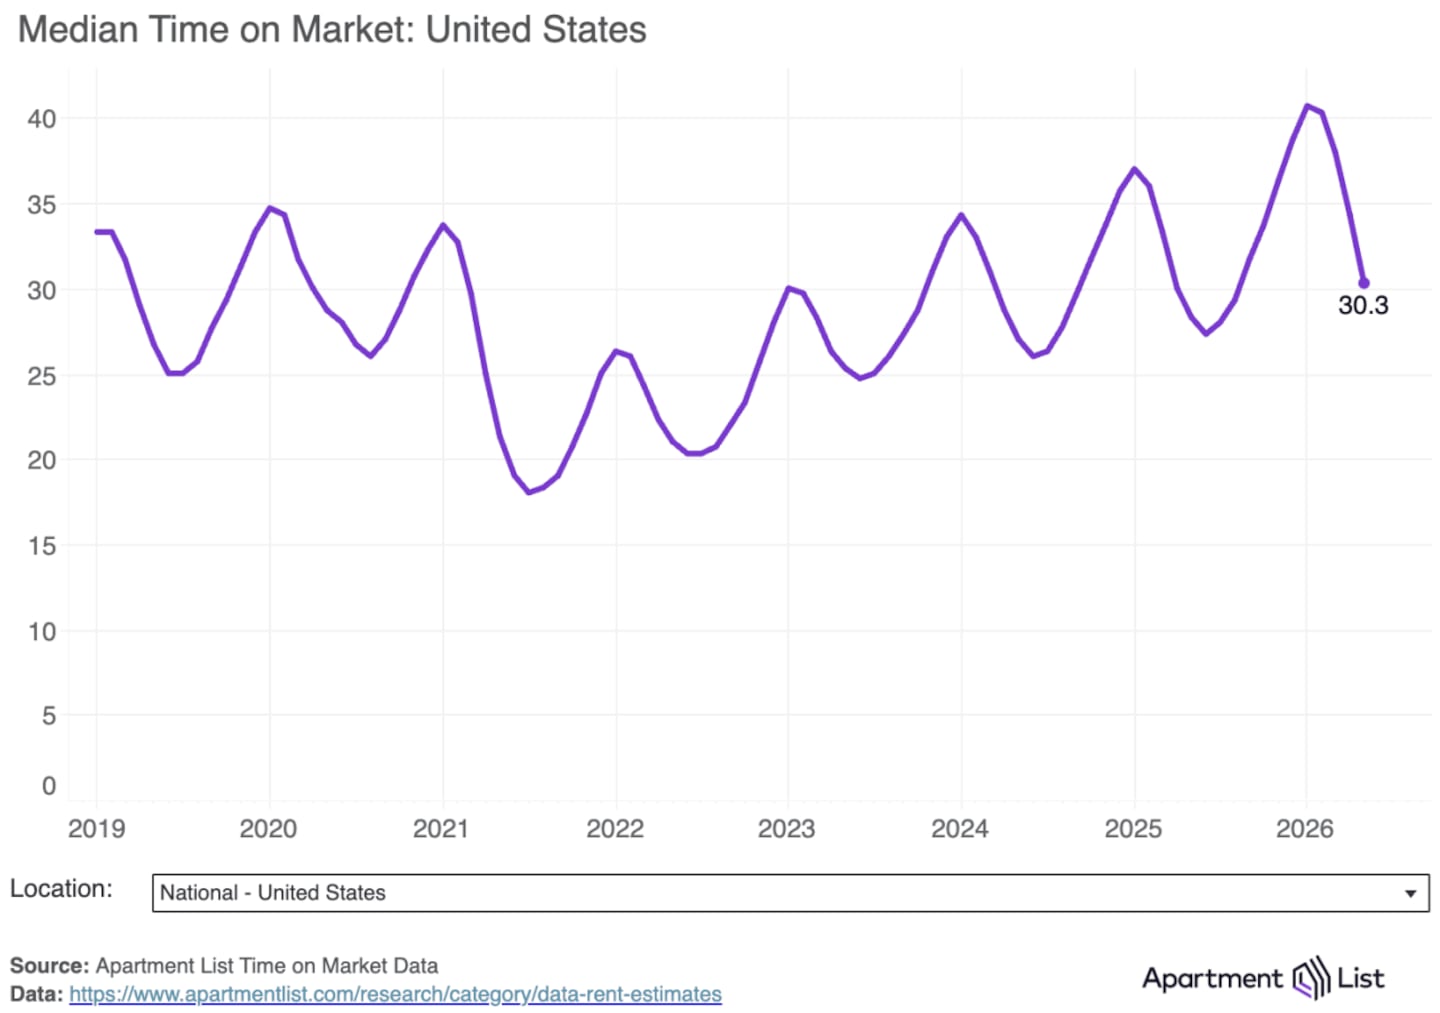
- Units are taking an average of 30 days to get leased after being listed, which is down from 34 days last month, but still two days longer than at this time last year.
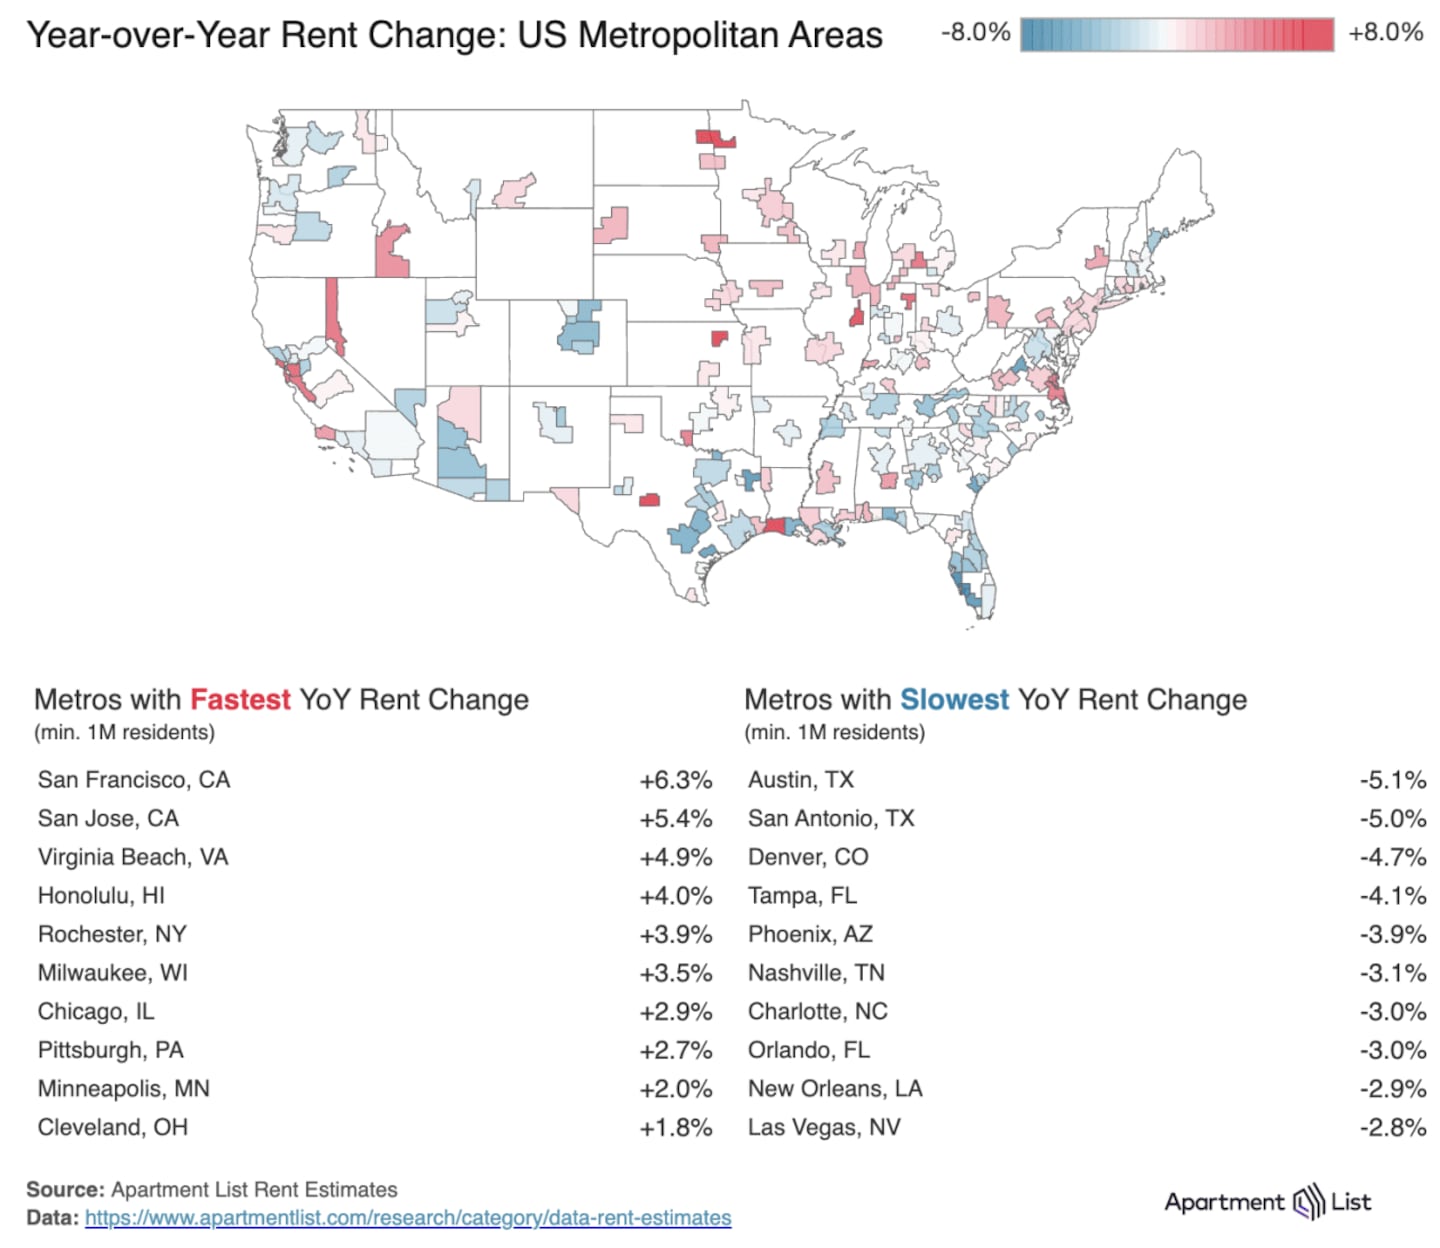
- The Austin, Texas, metro continues to have the softest conditions among the nation's large rental markets, with the median rent there down by 5.1% over the past year. At the other end of the spectrum, the San Francisco metro now sits atop the rankings of fastest year-over-year rent growth at 6.3%.
Apartment List
In dollar terms, the national median monthly rent now stands at $1,379, down $20 compared to May 2025. Prices peaked in mid-2022 after a year and a half of skyrocketing growth. Since then, the nationwide median rent has been gradually drifting down and has fallen from that peak by a total of 4.4%, or $63 per month. Despite the pullback in prices, today’s rent levels remain 20% higher than they were at the start of 2021.
Apartment List
Multifamily vacancy ticks down to 7.2%, first decline since 2021
The most important driver behind the soft market conditions that have persisted for over three years is a historic surge of multifamily construction. The construction boom peaked in 2024, when we saw over 600,000 new multifamily units hit the market, the most new supply in a single year since 1986. Since then, deliveries of new apartments have slowed considerably, while still remaining robust by historic standards. And even on the downslope of the boom, the market has been struggling to absorb the swell of new inventory.
Apartment List
Apartment List’s national vacancy index — which measures the average vacancy rate of stabilized properties in its marketplace — hit a peak of 7.3% in February, marking the highest level since at least 2017, which is when Apartment List started tracking occupancy. Since then however, the vacancy rate has ticked back down to 7.2%, the first decline in Apartment List’s national vacancy index since late 2021. In the four-plus years since, the vacancy rate has consistently loosened, gradually moving from record lows to record highs, but it appears to have finally hit its peak.
That said, the recent decline has been modest, and the vacancy rate remains elevated above its long-run average. And with mixed news on the labor market combined with renewed inflation concerns, there is reason to think that demand could be sluggish this summer. It's possible that the vacancy rate will simply plateau at this elevated rate, rather than continuing to decline in a meaningful way.
List-to-Lease time remains elevated at 30 days
As more vacant units have come onto the market, those units have also been sitting vacant for longer. Apartment List’s “time on market” index tells how long it takes for units to get leased after they are first listed on the platform. This “list-to-lease” time is a highly seasonal measure, and it ticked down this month, with units turning over more quickly as moving activity picked up. Units leased in May had been sitting on the market for an average of 30 days, down from 34 days last month.
Apartment List
Despite the month-over-month decline, list-to-lease time remains somewhat elevated. This month’s reading is the longest seen in any May going back to 2019 when the tracking begins (January’s 41 days set the overall record). Units are taking two days longer to turn over than at this time last year, and twelve days longer than they were in mid-2021 when the market was at its hottest. This lengthened list-to-lease time is in line with the generally cool rental market conditions observed in other key market indicators (e.g., negative rent growth and soft occupancy).
Rent declines are mostly concentrated in Sun Belt markets
There are 56 large metropolitan areas across the country that have a population over 1 million. In May, rents increased month-over-month in 54 of these markets, but rents remain down year-over-year in 33 of them. Rent trends vary significantly by region, with annual declines currently concentrated primarily in the South and Mountain West regions. Meanwhile, many markets in the Northeast, Midwest, and parts of the West Coast continue to see prices trend up.
Apartment List
Austin has seen the nation's sharpest decline among large metros — the metro-wide median rent there has fallen 5.1% in the last 12 months and is down more than 20% from its 2022 peak. The Austin metro is also significant for permitting new homes at the fastest pace of any large metro in the country, indicating the impact of new supply on softening rents. Austin is not alone in exhibiting this trend; among the 10 metros with the sharpest year-over-year rent declines, many also rank among the highest in terms of multifamily permits (e.g., San Antonio, Denver, Phoenix, Tampa, and Nashville). Notably almost all of these markets are located in the Sun Belt.
At the other end of the spectrum, the two Bay Area metros — San Francisco and San Jose — are currently logging the nation's fastest year-over-year rent growth at 6.3% and 5.4%, respectively, as the AI boom has created a wave of high-paying tech jobs there. A number of Midwest markets (e.g., Milwaukee, Chicago, Minneapolis, and Cleveland) have also been maintaining steady positive rent growth amid soft national conditions, with the region's relative affordability propping up demand.
Conclusion
As the rental market enters its busy summer leasing season, there are some early signs that the tide may be turning on the soft conditions that have defined the market over the past three-plus years. Year-over-year rent growth ticked up slightly, the vacancy rate ticked down, and list-to-lease times have gotten shorter. But despite the modest tightening over the past two months, multifamily conditions remain notably cool overall, and an uncertain macroeconomic outlook presents risks to rental demand. The coming months will provide more clarity on whether the market is simply plateauing or actually turning the corner to tighter conditions.
Complete Data and Methodology
All of the underlying data presented in this report is freely available on Apartment List's rental data download page, where you can find the full monthly history of rent estimates, vacancy index, and time on market index at various geographic levels (national, state, metro, county, and city).
This story was produced by Apartment List and reviewed and distributed by Stacker.